Part One of a two-part series on data at the subnational level published by Christine Ajulu, Deputy Executive Director
Imagine a nurse in a county health facility somewhere in Kenya. Call her Amina. Every month, she fills in a register on how many children have been immunised. She writes the figures neatly, signs the form, and sends it up the chain. Then she goes back to the thing she actually worries about, which is the queue of mothers and other patients. The numbers she has just recorded disappear into a system she will never see again. Nobody asks her about them. Nothing visibly changes because of them. And so, slowly, the register becomes a chore rather than a tool.
Multiply Amina by tens of thousands of officials across forty-seven counties, and you begin to see the shape of a problem that frustrates everyone who works on data and governance in Kenya. We have built portals, passed laws, trained statisticians, and funded dashboards. And yet, at the level where devolution was supposed to bring government closer to the people, data still does not move the way it should. In this article, I want to sit honestly with two questions: why is this so hard? Secondly, what can we actually do about it?
In this article, let’s start with the first question.
Why It’s So Hard
Devolution promised data. It did not guarantee its use.
Kenya’s 2010 Constitution transferred real power to forty-seven new county governments, handing them responsibility for health, agriculture, water, planning, and much more.1 Devolution is, at its core, the transfer of decision-making and implementation powers, functions, responsibilities, and resources to elected local structures, anchored on the supremacy of the Constitution, the sovereignty of the people, and the principle of public participation. With that transfer came an explosion of data: clinic records, budget figures, land registries, school enrolments, and the citizen-generated data that perhaps floods in from every ward.
But here is the uncomfortable truth that international assessments keep surfacing: Kenya, an early African pioneer of open data, has scored poorly precisely where devolution lives. In a recent global evaluation, Kenya received a score of 30, below the global average of 49, and a rating of zero for subnational capabilities, open data initiatives, and support for data reuse, alongside a very low rating for training civil servants to manage data.2 The national frameworks, from the Data Protection Act to the open data portal launched back in 2011, were largely designed at and for the national level3. Their translation downward has been uneven, inconsistently resourced, and rarely monitored. The policy says one thing. The county experiences another.
Six reasons the data won’t move
When you talk to the people inside the machine, the same handful of obstacles come up again and again.
1. The data does not align with the political agenda. A governor is elected on a manifesto: roads, jobs, water, and a new hospital. Data that might flatter those promises is welcome. Data that complicates them is, at best, inconvenient. A statistics unit that reports rising stunting rates or stalled projects is not bringing good news. Public administration scholars have a name for the underlying tension. Under principal-agent theory, the people we elect (the agents) hold information the public (the principals) cannot easily see, and they face every incentive to release the flattering figure and bury the awkward one.4 Data transparency, in this light, is not a neutral technical act. It is a political risk that someone has to be willing to bear.
2. County staff are not motivated to do it. Return to Amina. She gains nothing from filling in her register well and loses nothing from filling it in badly. The work of collecting and reporting data sits on top of an already overloaded job, with no reward attached and no consequence for neglect. When effort is invisible, and outcomes are never fed back, even conscientious officers eventually do the minimum. This is not laziness. It is a rational response to a system that has forgotten to make the work matter.
3. The expertise simply is not there, on either side. Handling data well is a skill, and so is; cleaning, checking, interpreting and turning it into something a decision-maker can act on. Many county statistical units (or units and departments serving these functions) are thin, under-trained, and pulled in several directions. The civil-service training gap is exactly what those zero and near-zero international ratings were flagging. And this shortage is not only a government problem. The non-state actors meant to hold power to account, the community organisations, NGOs, and local journalists, are often no better equipped. A community group may collect powerful evidence about a failing clinic and then have no idea how to turn it into an argument that a budget committee will take seriously.
4. The default posture is resistance to change. Ask anyone who has tried to introduce a new data system into a county office, and they will tell you about the polite, immovable wall. New systems threaten established routines, expose old errors, and shift who holds informal power. Resistance to change is one of the most reliably documented phenomena in organisational life, and it is rarely about the technology itself. It is about uncertainty, loss of control, and the entirely human preference for the way things have always been done. A dashboard that makes performance visible can feel less like a tool and more like a spotlight.
5. The money for data is ad hoc and thin. Statistical work is chronically under-funded at the subnational level, and what funding exists tends to arrive in fits and starts, often riding on a donor project that ends when the grant does. The broader literature on subnational statistics is blunt about this: the allocation of resources and statistical capacity is extremely imbalanced and biased against subnational institutions, with the result that data quality problems are far more numerous and varied at the local level. A survey gets funded this year and not next. A system is built and then cannot be maintained. Sustainability is the casualty.
6. There is no system tying it all together. Even where individual pieces work, they rarely connect. Think of the data ecosystem as a value chain with three links: the supply of data (collecting and producing it), the demand for data (someone actually wanting and asking for it), and the use of data (turning it into decisions).
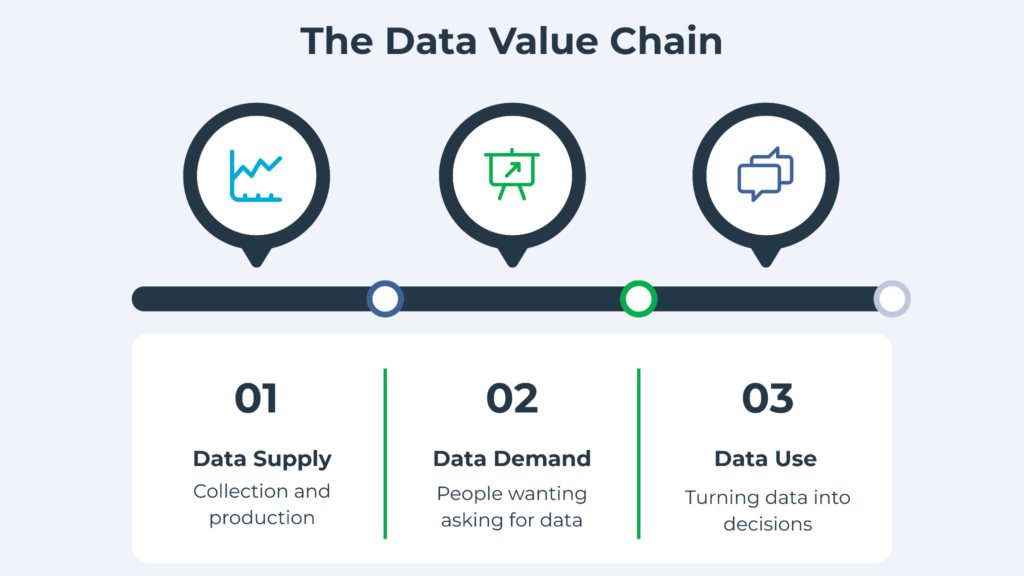
In most counties, these three links are weak and disconnected. Subnational statistical systems are typically not coordinated in any systematic way; many institutions collect overlapping data, and the relationship between line departments and the national statistics office is generally weak. You can pour money into the supply side, building more surveys and more dashboards, and still see nothing change, because nobody on the demand side is asking for the data, and nobody on the use side is acting on it.
“There is no direct need or interest in data at a personal level”
This single sentence, which surfaces again and again in fieldwork, may be the deepest explanation of all. Step out of the government office and into the street. A boda boda rider, a market trader, a farmer, a nurse: ask them about “open data” or “information rights” and you will mostly get a shrug. Not because they do not care about whether the clinic has medicine, the title deed is processed, or the ward fund was spent. They care intensely. But the link between that lived concern and the abstract thing called “data” has never been made visible to them.
And the same is quietly true inside the system. For Amina, for the budget officer, for the clinical officer keying numbers into a register at the end of a long shift, there is no direct personal need for the data either. It is something they produce for others, not something they use for themselves. When data has no personal pull, neither for the citizen who might demand it nor for the official who must produce it, it becomes a duty without a constituency. And duties without constituencies are the first things to be neglected when time and money run short.
This is why so many well-funded data initiatives quietly stall. They treat the problem as a supply problem, with more data and better portals, when the binding constraint is a demand-and-use problem rooted in trust and relevance. People disengage from data not because they do not understand it, but because experience has taught them that engaging with it changes nothing. That is not ignorance. It is an accurate reading of how data relationships have historically been structured.
A target hit, a point missed
There is one more trap worth naming, because it explains why even well-intentioned reform can backfire. Governments love performance management: performance contracts, scorecards, service-delivery targets. The logic is sound. Set an indicator, measure it, and hold people accountable. But scholars of public administration have watched this logic curdle for decades. When you attach high stakes to a narrow indicator, people optimise for the indicator rather than the outcome it was meant to capture, a phenomenon so common it has a slogan: hitting the target and missing the point5. Officials learn to produce the number that satisfies the contract while the underlying reality stays exactly where it was. The data looks excellent. The clinic still has no medicine.
This is the difference between compliance and accountability. A county can report that it surveyed ten thousand citizens and yet has never once listened to a single one of them. Performance systems built on gaming-prone indicators can generate mountains of clean, timely, useless data, the very opposite of what data governance is supposed to deliver. Recognising this matters, because it warns us against the seductive idea that the fix is simply to demand more reporting. More reporting, badly designed, can make the problem worse.
So why is it so hard?
Pull the threads together, and the picture is not really about technology at all. It is about incentives, trust, and relevance. The data does not move because the politics does not reward moving it, because the staff are not motivated to move it, because the skills to move it are scarce on every side, because the institutional reflex is to resist anything new, because the money to sustain it is thin and erratic, and because the supply, demand, and use of data have never been knitted into a working system. And beneath all of it sits that quiet, devastating truth: at a personal level, almost nobody, neither the citizen nor the official, feels they actually need the data.
None of this is a counsel of despair. Every one of these obstacles has been overcome somewhere, by someone, often within Kenya itself. In Kilifi, in health-workforce systems, in citizen-led mapping projects, there are real examples of data that moved and changed something. The question is what those examples have in common, and whether their lessons can be made deliberate rather than accidental. That is the subject of the second article in this series, where I turn from the problem to the solution.
Until then, the next time you hear that a county “has the data”, it is worth asking the harder questions. Does anyone need it? Does anyone trust it? And is anyone, anywhere, actually using it to make a decision? Those three questions, more than any portal or dashboard, will tell you whether the numbers are alive or merely filed.
REFERENCES
- Constitution of Kenya, 2010, Article 6 and the First Schedule, which divide the territory into 47 counties; Articles 174–176 and the Fourth Schedule assign devolved functions including health, agriculture, water and county planning. See Kenya Law, “Laws on Devolution,” https://kenyalaw.org/kl/index.php?id=3979, and the full text at http://www.parliament.go.ke/sites/default/files/2017-05/The_Constitution_of_Kenya_2010.pdf. ↩︎
- Global Data Barometer, 2022 edition. Kenya scored 30 on the Capability theme against a global average of 49, with zero ratings for subnational capabilities, open data initiatives and support for data reuse. Figures reported in the Open Government Partnership commitment “Open Data for Development” (KE0034), https://www.opengovpartnership.org/members/kenya/commitments/KE0034/; underlying assessment at https://globaldatabarometer.org/. ↩︎
- The Kenya Open Data Initiative portal (opendata.go.ke) was launched on 8 July 2011: World Bank, “Government of Kenya Releases Data to Public on Easy to Use Web Portal,” https://www.worldbank.org/en/news/press-release/2011/07/08/government-kenya-releases-data-public-easy-use-web-portal. The Data Protection Act is No. 24 of 2019, in force 25 November 2019, giving effect to Article 31 of the Constitution: https://www.kentrade.go.ke/wp-content/uploads/2022/09/Data-Protection-Act-1.pdf. ↩︎
- On principal–agent theory and information asymmetry in the public sector, see J.-J. Laffont and D. Martimort, The Theory of Incentives: The Principal-Agent Model (Princeton University Press, 2002), and the overview in B. M. Mitnick, “Origin of the Theory of Agency,” https://www.researchgate.net/publication/256040649. ↩︎
- The phrase comes from G. Bevan and C. Hood, “What’s Measured Is What Matters: Targets and Gaming in the English Public Health Care System,” Public Administration 84, no. 3 (2006): 517–538, which identifies “hitting the target and missing the point” as a form of gaming. Related: C. Hood, “Gaming in Targetworld,” Public Administration Review (2006). The underlying logic is often summarised as Goodhart’s law. ↩︎