This is truly unchartered for me since I have never written a blog before – even though I have been a software geek for more than two decades (!).
My job at the Open Institute is to manage technology largely and in the three years I have worked here, I have generally remained in the background – being involved in the Open Data work, relating with government officials and CSOs at technical level.
Having attended several conferences around the world, the conversation of Open Data has really taken traction. As a person who has worked in the “hardcore” data space, I note that we have a tendency to forget the complexities the back-end people or data analysts face in order to produce better reports, visualisations and simple format outputs.
There are these four areas that should always be considered in the design of Open Data initiatives;
- Literacy – Where the institutions that have data need to be enlightened on the various ways to output data. The data (in a perfect world) needs to be machine ready, meaning that it’s a soft copy and it’s easy to cut and paste to a table. Unfortunately, because of a lack of literacy, the world is often not-so-perfect. One time, we asked for data in an MS Excel format. True to our request, we got it, only that they took a screenshot of the MS Excel table and embedded it on a pdf document!
- Timeliness – It makes no sense to have historical data when you want you are reporting on say, a health issue or outbreak. Real time data is much more efficient. You need to make critical reports to support the areas affected. But timeliness also goes into the challenges that come with approvals of data. It often is ready on time but takes a long time to be released.
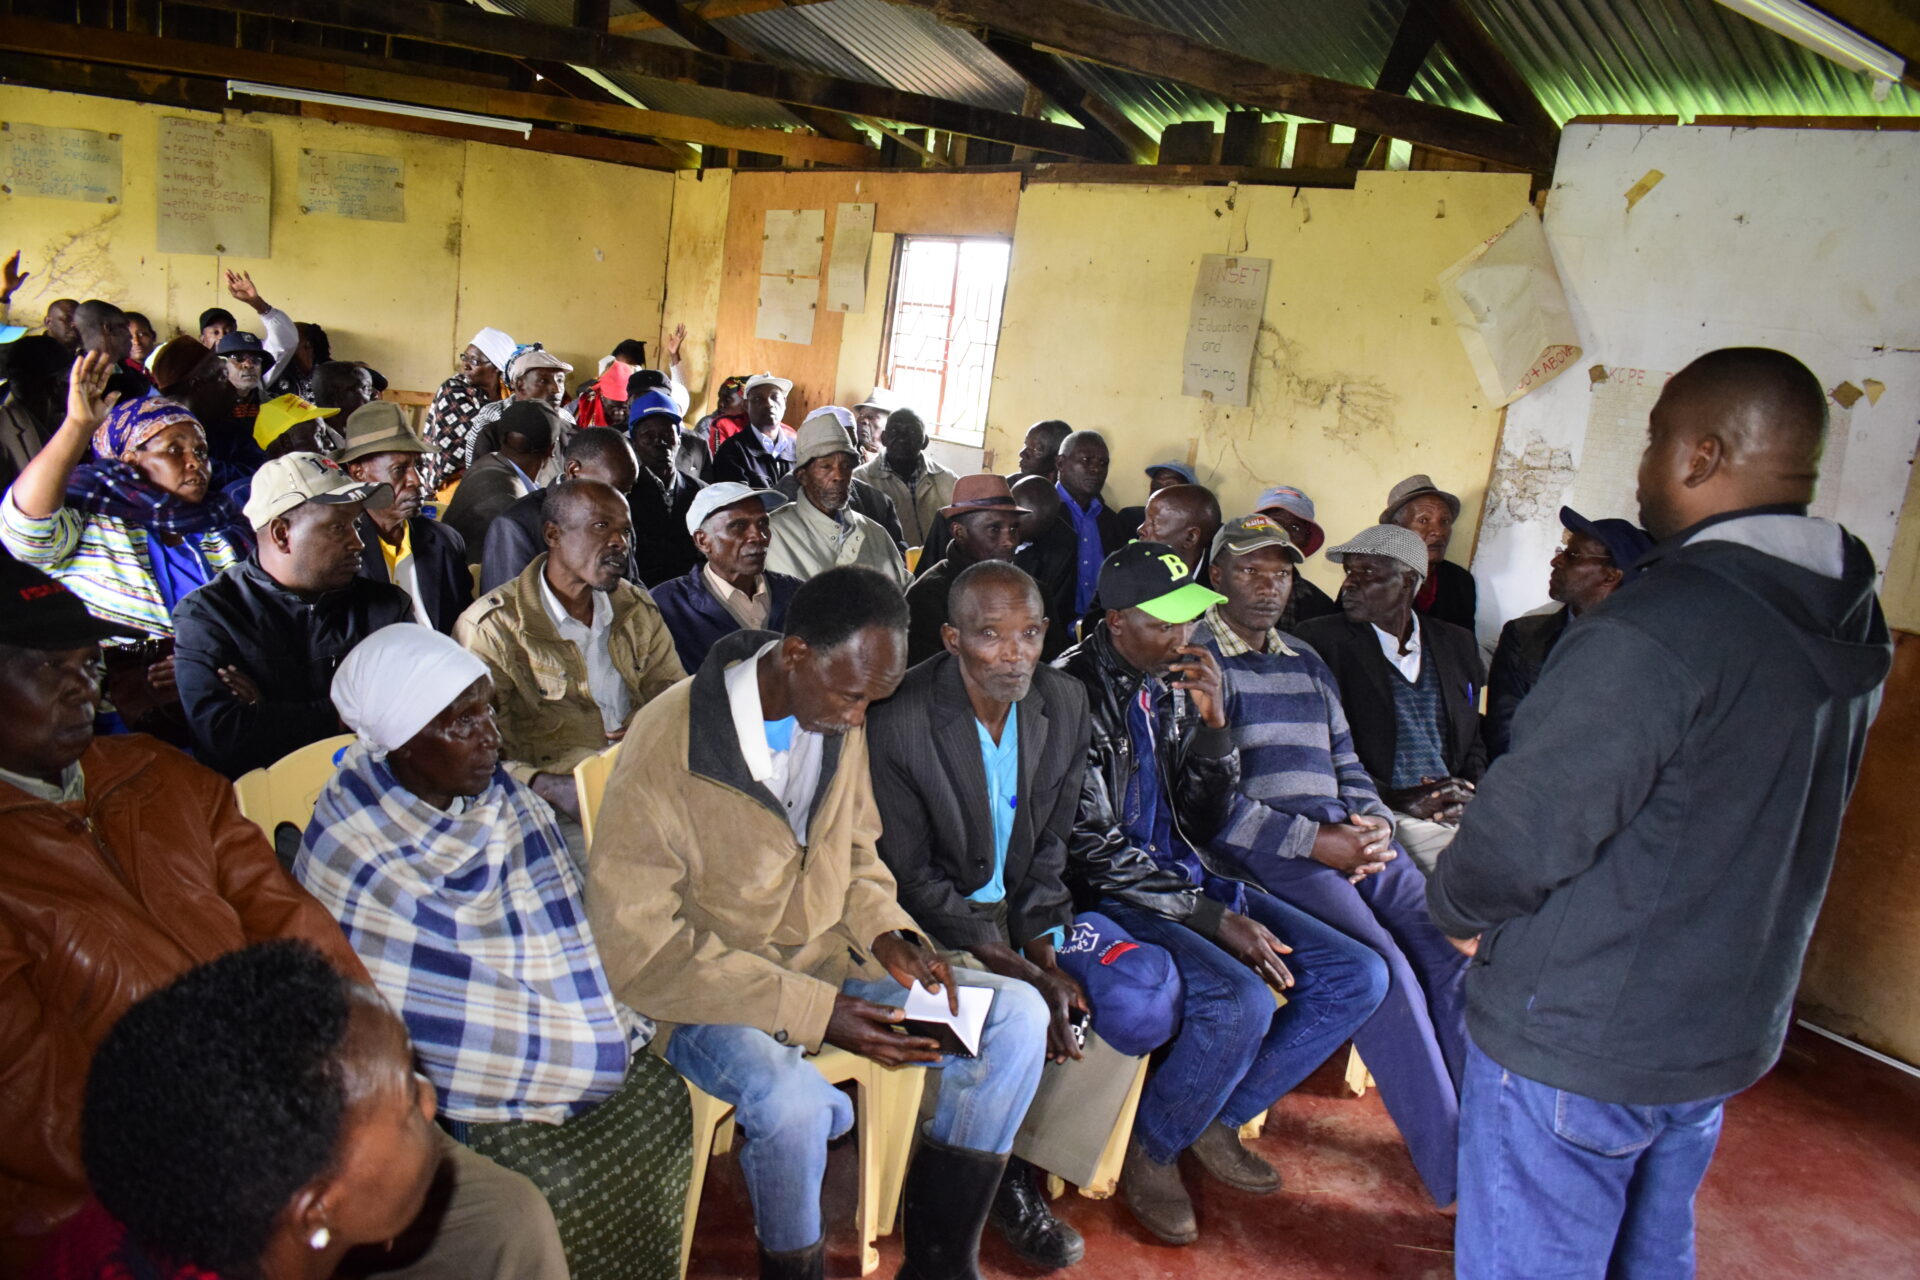
- Culture – Perceptions of communities may prove to be a barrier especially if the way information is presented does not augur well with their understanding. It might not be easy to go to a rural community and talk of a budget item like a road construction that will cost Kshs 5 million when they can’t appreciate the value of the amount. One might need to equate the value to a number of potato sacks that are arranged from one end of the field to the other for them to appreciate. Visualization aspects in turn become more effective in this respect. In this respect, we have been known to print such visualisations as a means to activate the citizen’s imagination.
- Technology – most often you hear stakeholders mention that data will be in mobile or desktop format. The question is who has these mobile devices? What applications are expected to run on this device to deliver the information? Are there developers to support new technology that the application is built with? It is considerably better to build applications that are simple with easy to support development languages and tools.
One thing that is to be expected is that as the Data Revolution gains momentum in the coming days, many new programmes will be designed. I hope that as we do, these four points are built into them.


